CurateSuite
Guide7 min read

Financial Reporting and Analysis: An AI Workflow Guide

A sequencing framework for adopting AI in financial reporting: automate the workflow stage costing the most hours and already mature across the tool category.

By CurateSuite
A blue magnifying glass hovers over a dense grid of dark rounded tiles; inside the lens glows a three-column bar chart with the tallest bar lit in orange.

Most firms that start automating finance reporting and analysis pick the stage that demos best: AI-written commentary that turns a variance into a paragraph of narrative. It feels like magic in a sales call. It is rarely the stage eating the most hours today.

A better first question is which stage of the workflow the vendor market has already solved broadly, and which stage consumes the largest share of your team's monthly hours. Put your automation dollars where those two answers meet. Skip the stage that only looks impressive in a demo.

This guide works through that logic across the four stages of producing a financial report, then gives you a two-question framework you can apply to your own firm.

The four stages

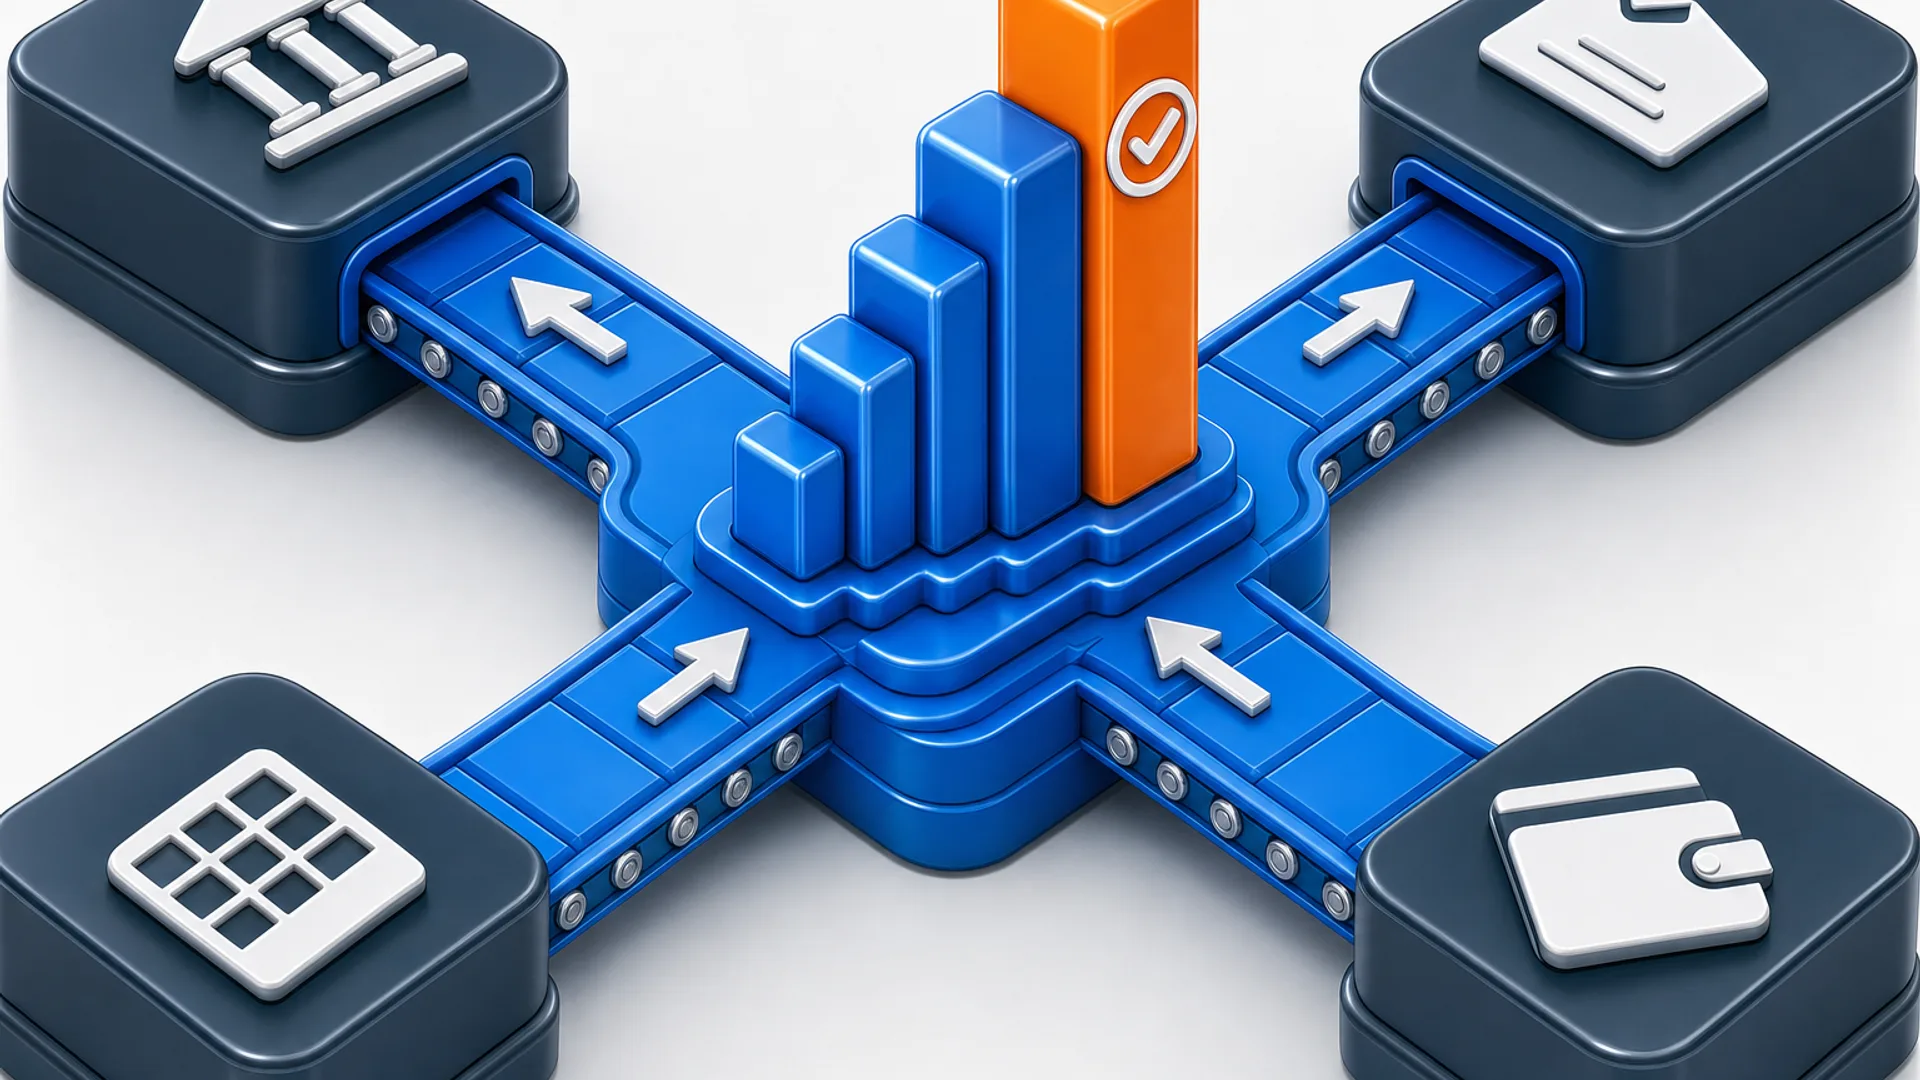
Every recurring financial report, whether it goes to a client or to your own board, moves through four stages:

  1. Pull and consolidate. Get the numbers out of the source systems and into one place, across entities, currencies, and charts of account. If you are still exporting CSV files out of QuickBooks, this is probably where your week evaporates.
  2. Check what moved and why. Compare actuals to budget or prior period, find the variances that matter, and trace them back to their cause. This is the stage that turns raw data into something you can analyze.
  3. Write it up. Turn the variance analysis into plain-language commentary the reader can act on. This is where a human voice matters most, and where AI tools are thinnest on the ground.
  4. Get it to the right person. Package the numbers, the narrative, and the supporting detail into a deliverable: a dashboard, a board pack, a client-ready report.

Where the hours actually go today

For most accounting teams, the time sink sits in the first stage. Accountants report losing an average of five hours a week moving, re-entering, or reconciling data across disconnected systems before any analysis starts. The same CPA Practice Advisor survey found that 30% of accountants name manual data cleanup as the top blocker to doing more advisory work, ahead of staffing shortages (24%) and app overload (16%).

Manual consolidation eats time because it has to happen before anything else. Miss a mapping rule in one entity and the whole report is wrong. Fixing it is slow, invisible work that no client ever sees. It is also exactly the kind of work that software has been doing reliably for years.

Where AI is mature, and where it stays thin

Our FP&A and advisory reporting category tracks 11 tools across the four workflow stages. One of them, ScaleXP, handles revenue recognition and month-end journal automation, not the reporting or consolidation functions this guide covers. So it falls outside the scope of this comparison, and the remaining ten tools provide the statistics below.

Workflow stageHow common (out of 10)Example tools
Pull and consolidate8Fathom, Spotlight Reporting, LiveFlow
Check what moved and whyNo verified count availableDatarails, Planful
Write it up as narrative5Fathom, Aider, Datarails, Vena, Syft Analytics
Get it to the right person8Same as consolidation; dashboards are table stakes

Eight of the ten tools are tagged for consolidation and dashboards: Spotlight Reporting, Planful, Fathom, Cube, LiveFlow, Syft Analytics, Datarails, and Vena. These are mature capabilities, present in tools that have been in the market for years, and they work about the same in every product.

Five tools in the category are described as writing AI narrative commentary for the reader: Fathom, Aider, Datarails, Vena, and Syft Analytics. If you want software to read a variance and produce a paragraph explaining what happened, those are your options. That is half the category, which is more than the old figure of three, but it still trails the eight tools that handle consolidation and dashboards.

A separate capability, the three-way forecast that links profit and loss, balance sheet, and cash flow in one model, is even rarer. Only Fathom, Spotlight Reporting, and Jirav offer it across all three statements. Again, three out of ten.

This is the gap the sequencing framework hangs on. The stages of the workflow that have been solved widely are not the stages that generate the best sales demos. The stage that demos well, AI commentary, is available in fewer tools than consolidation and dashboards, and it remains the thinnest stage in the counted set.


Adoption is rising, but it stays shallow

Industry-wide, finance teams are buying AI faster than they are using it. 56% of finance leaders report using AI, up from 17% in 2023. Yet only 17% are actively using AI in core finance workflows, and 45% of finance teams remain in limited pilot mode, according to CFO Connect's State of AI in Finance 2026 report.

That gap between adoption and use is a sequencing problem. Teams license a tool because it has AI commentary, then discover their data is not clean enough to feed it. The commentary writes sentences about variances that are wrong because the consolidation failed upstream. The software does not fix the messy data; it just narrates it faster.

Automating the mature stage first flips that sequence. You fix the data, then you can trust any AI that sits on top of it. If you automate the commentary first, you are asking a thinner tool to cover for a broken foundation.

The two-question framework

Apply this to your own firm before you buy anything:

  1. Identify the stage that consumes the most of your team's time each reporting cycle. For most firms, the answer is consolidation, because it is the stage that has to be redone every reporting cycle and has the most failure modes. Track your own time for one close before you answer.
  2. Determine whether that stage is already a commodity across the tool category, or if it remains a sales-demo promise. Look at the counts from the catalog table: consolidation and dashboards are mature across eight of ten tools; narrative AI is available in five. If your biggest cost lives in the mature stage, automating it is a safe, high-return move. If your biggest cost lives in the less proven stage, you are making a bet on a smaller set of tools.

Automate the overlap. If the answer to question one is consolidation and the answer to question two is that eight tools do it well, start there. If the answer to question one is commentary, be aware you are choosing from five tools, and the quality of the output still depends on the consolidation feeding it.

The full pricing and tool breakdown is in our financial reporting software guide, which compares the same tools by what you actually pay. This guide is about sequence, not price.

It plays out differently by firm type

An advisory firm and an in-house finance team are not automating the same stage first, because they are not spending their hours in the same place. Client-facing firms bill for advisory, so wasted time in consolidation is lost margin. In-house teams answer to a CFO, so dashboard delivery and board-pack pacing matter more. The stage that costs the most hours changes.

That split is covered in detail in our AI tools for FP&A and reporting guide, which breaks down the same category by firm-side versus client-side needs. Use the framework here to pick your stage, then use that guide to pick your tool.

The sequencing rule, restated

Automate the stage that is both your worst time sink and already a commodity across the category. For most firms that means consolidation and dashboard delivery first, narrative AI later. If you want the shortcut through the whole category, the CurateSuite matchmaker asks about your delivery model, your systems, and your stage of pain, then points you at the tools that fit.

Common questions

Which workflow stage should I automate first?

The stage that costs the most manual hours this month and is already mature across the tool category. That usually means consolidation and dashboard delivery before narrative AI, because eight of ten tools in the category do the first two well and half do the third.

What does each step produce: reporting or analysis?

Reporting is the assembly: pulling the numbers, reconciling them, and presenting them accurately. Analysis is the interpretation: explaining why a variance happened and what to do about it. The two steps feed each other, but they are not the same skill or the same software feature.

Does AI commentary writing replace my own review?

No. AI commentary can draft a variance explanation from a clean dataset, but only five tools in the category offer it, and none of them can check the underlying reconciliation for you. Treat the draft as a first pass your reviewer still has to own.

How much time do firms actually lose to manual reporting?

Accountants report losing an average of five hours a week moving, re-entering, or reconciling data across disconnected systems. That is roughly one full workday per month per accountant before any analysis begins, which is why consolidation is the stage most firms should automate first.

Find the right AI tools for your firm

Seven questions, two minutes, a short list of the five tools that fit your firm best. Your results, instantly. No sign-up needed.

Take the matchmaker

Tools referenced in this article

More articles

Last updated 2026-10-18. Tool comparisons are based on vendor-published specs. See our methodology.