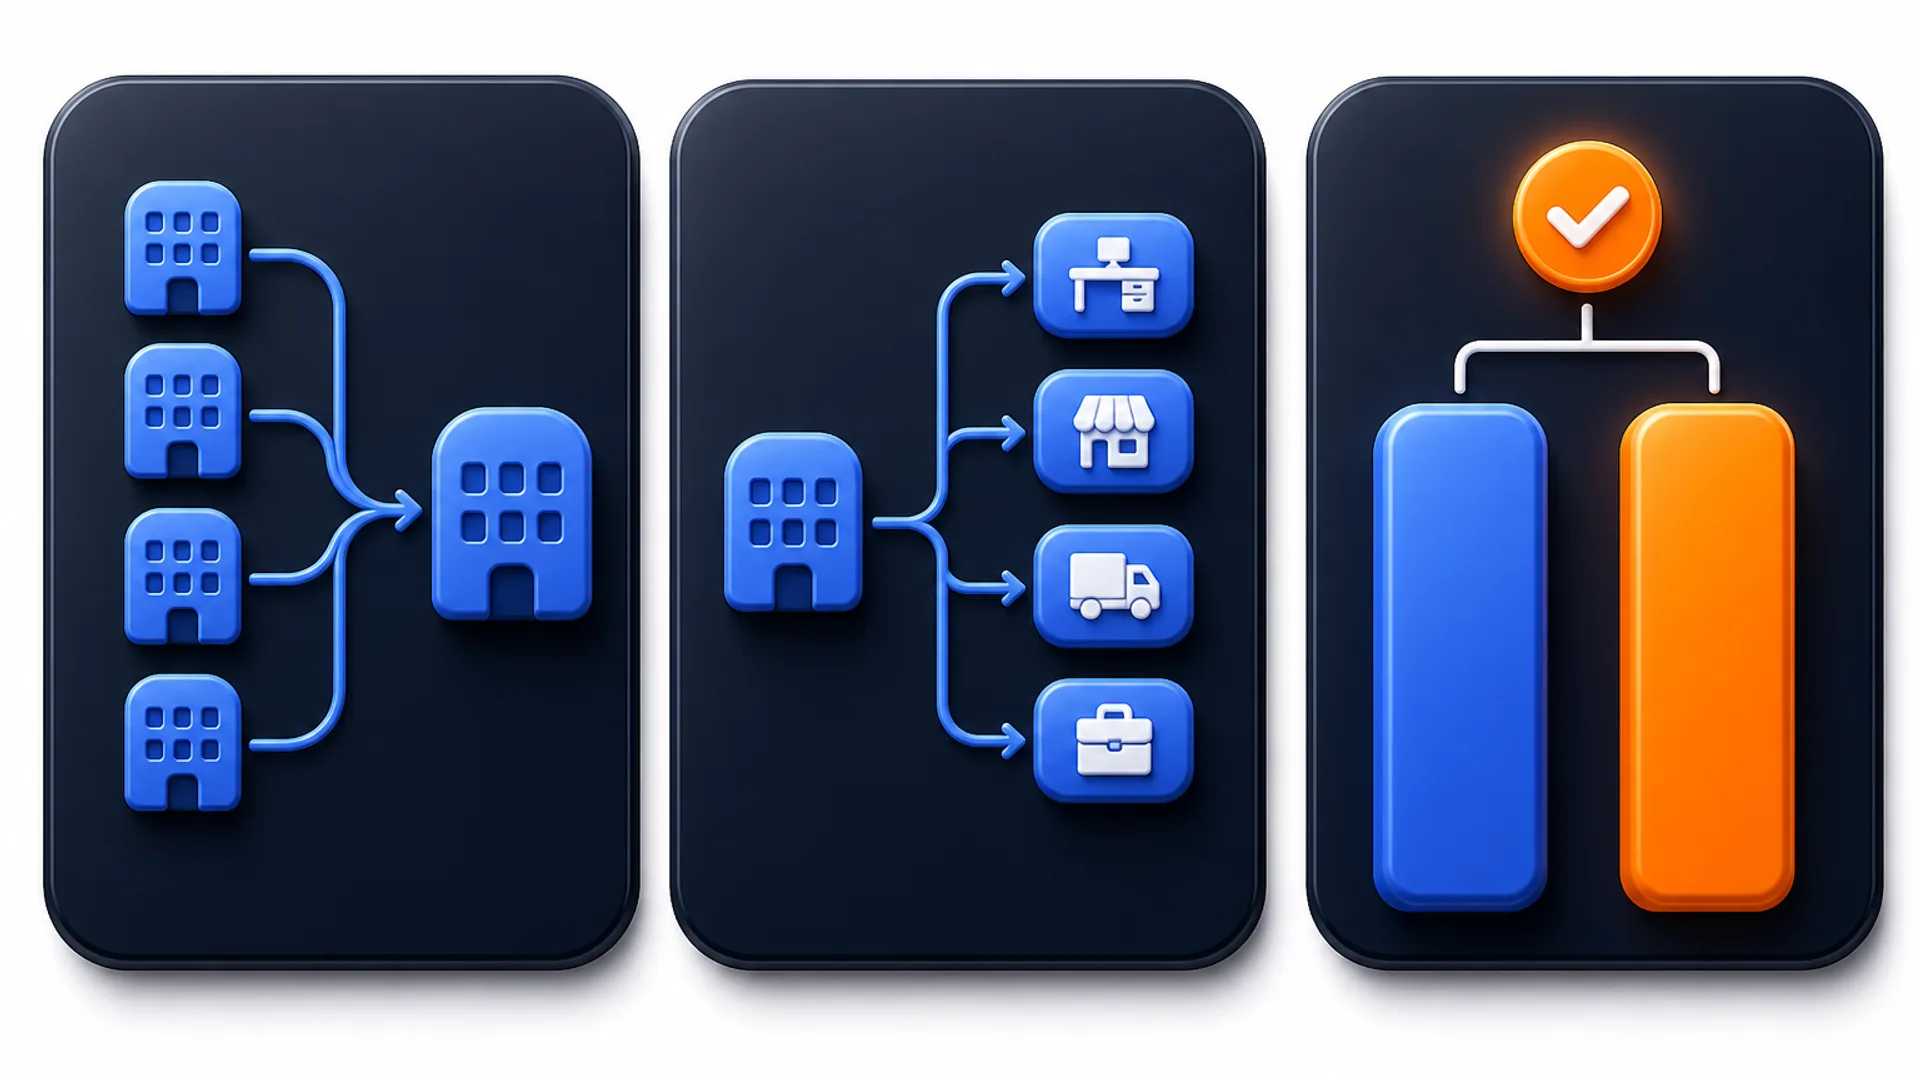
Most accounting firms shopping for p&l software are really shopping for three different capabilities that share one label. One firm wants to roll up several client entities into a single combined profit and loss statement. A second firm needs the P&L for a single entity divided by department, location, or project. A third wants to compare actual results against a budget. Vendors tend to imply that all three come together. Looking at each tool's own published specs tells a different story.
For the broader category, see the AI financial reporting and analysis guide and the FP&A tool guide. For a step-by-step look at automating the whole reporting process, see a practical walkthrough of financial reporting automation.
The three things profit and loss software can mean
"Profit and loss software" is not one thing. In specifications and feature lists, it shows up as three separate capabilities that solve different problems.
Multi-entity consolidation combines the financials of several separate legal entities into one P&L. The software handles intercompany eliminations, currency translation, and a single set of numbers. This matters when a firm or client owns multiple companies and needs a unified picture.
Department, location, or project breakdown splits one entity's P&L into segments. The legal entity stays whole, but the user can see profit by division, office, or engagement. That is a different axis than consolidation.
Budget versus actual compares the P&L against a plan. The output is a variance column, not a trend or a forecast. It answers "how did we do against what we said we would do."
A buyer usually needs one of these, sometimes two. Vendors rarely make the distinction obvious. The table below checks each tool's own documentation for all three.
Three products document multi-entity consolidation as their primary function: Fathom, Spotlight Reporting, and Syft Analytics.
Fathom consolidates multi-currency financials across entities. Pricing is per entity, starting at $59 per month for one company, then $315 for ten, $450 for twenty-five, and $805 for fifty. Portfolio tiers go higher, up to unlimited companies with metric drill-down. Fathom does not document department-level breakdown or budget-versus-actual comparison. Its trial is 14 days, per the pricing page.
Spotlight Reporting consolidates up to 500 entities at flat firm pricing. Basic is $329 per month for ten organizations, Super VCFO covers twenty-five at $495 or seventy-five at $995. Enterprise is custom and unlimited. Differentiators include franchise benchmarking and an ESG module. Spotlight does not document department breakdown or budget-versus-actual. Its 14-day trial requires no credit card, per its pricing page.
Syft Analytics documents consolidation and budget-versus-actual, but not department breakdown. It has a free tier forever. Standard is $23 per month. Plus at $47 adds multi-currency and consolidation. Advanced at $95 adds driver-based modeling. Enterprise is custom for ten or more entities. Paid tiers come with a 14-day trial.
One of the ten tools has all three capabilities named in its own feature list: LiveFlow. Planful comes close, but its department capability is on the planning side, not a P&L split.
LiveFlow states that it combines data from multiple QuickBooks or Xero files into a single set of numbers, eliminating the need for manual eliminations. It also documents department and project reporting, and budget versus actuals. Pricing is custom and sales-quoted, with no trial. The feature list is here.
Planful describes consolidation for groups of entities, including intercompany eliminations and consolidated reporting. It also covers department-level planning, where department owners submit their own budget numbers, with rolling forecasts across departments or entities, and variance reporting that compares plan against actual. It does not document a report that splits the P&L by department, location, or project. Pricing is custom, sales-led, by modules, users, and term, with no trial. Its consolidation approach is here.
When a firm requires all three capabilities in a single product, LiveFlow is the only option in this list whose documentation makes that claim. Planful covers consolidation and budget vs actual along with department-level planning input, but it does not split the P&L by department.
Budget versus actual, with or without consolidation
For full budgeting and forecasting comparisons, see the FP&A tool guide. Some tools emphasize budget-versus-actual comparison but differ on consolidation and department breakdown.
Jirav documents budget versus actual as a named feature in its Controller Essentials plan, $50 per user per month. That plan includes historical financials, budget vs actual, AI forecasts, and a one-year horizon. CFO Enterprise at $150 per user per month adds driver-based budgeting, staffing models, five scenarios, and a seven-year horizon. Jirav produces three-way statements per client but does not document cross-entity consolidation or department breakdown. No trial is offered, per pricing.
Syft Analytics appears again: its Standard tier names actuals vs forecast vs budget as a feature, and consolidation is available from the Plus tier. No department breakdown is documented.
Datarails consolidates data from accounting, ERP, and HR systems into one layer. Its AI detects variances and trend shifts and provides written descriptions of the changes, but there is no named budget-versus-actual feature on the P&L. Department breakdown is not documented. Pricing is custom and sales-led, with no trial.
Cube offers a central data layer with two-way sync to Excel and Sheets. Actuals sync in from the ledger, so a budget-versus-actual report updates without manual exports. Department breakdown is not documented. Pricing is custom. Third-party estimates put entry around $1,250 per month. No trial.
Vena documents consolidation and lists budgeting as a capability, but has no named budget-versus-actual on the P&L and no department breakdown. Differentiators include role-based tiers (power user, contributor, view-only) and an AI copilot. Vena's pricing follows a per-user model with annual contracts and custom quotes. No trial.
Aider is built for period-close automation and per-client AI reports. It is priced per client entity, about $10 per client per month with a $150 monthly minimum and a 12-month commitment. Aider offers a firm-wide dashboard that spans multiple clients, but it does not produce a single consolidated multi-entity P&L. It does not document department breakdown or budget-versus-actual. No trial is offered.
This table reflects what each tool documents on its own site, compared the same way across every tool. "Not documented" means the capability is not named in the vendor's current feature or pricing pages.
| Tool | Combines several entities | Splits by department or project | Compares plan vs actual | Starting price |
|---|
| Fathom | Yes | Not documented | Not documented | $59/mo, 1 company |
| Spotlight Reporting | Yes | Not documented | Not documented | $329/mo, 10 orgs |
| Syft Analytics | Yes | Not documented | Yes | Free tier; $23/mo paid |
| LiveFlow | Yes | Yes | Yes | Custom |
| Planful | Yes | Partial (budget input) | Yes | Custom |
| Jirav | Not documented | Not documented | Yes | $50/user/mo |
| Datarails | Yes | Not documented | Not documented | Custom |
| Cube | Yes | Not documented | Yes | Custom (est. $1,250/mo) |
| Vena | Yes | Not documented | Not documented | Per user, custom |
| Aider | Not documented | Not documented | Not documented | ~$10/client/mo, $150 min |
See the full FP&A and advisory reporting category for more tools in this space.
How to choose
Start with the one capability you actually need.
If you are rolling up financials for several client entities, Fathom, Spotlight Reporting, and Syft Analytics all document consolidation. Fathom prices per entity, Spotlight and Syft price per firm.
If your firm needs department-level P&L splits along with consolidation and budget-versus-actual, LiveFlow is the only tool whose documentation covers all three. Planful is the close alternative when the department requirement is planning input instead of a P&L split. Expect sales-quoted pricing and no free trial from either.
If your main need is budget-versus-actual comparison on a single entity, Jirav is the clearest fit. Its specs name budget vs actual as a feature and it handles three-way statements per client without cross-entity consolidation.
Before you buy, check whether you need consolidation, department breakdown, budget-versus-actual, or some combination. Then verify that the tool's own feature list names that capability. The marketing label "p&l software" will not tell you.
When you are ready to map out the whole reporting workflow, start with the finance reporting and analysis workflow guide. To narrow the list by your firm's answers, use the AI tool matchmaker.
Common questions
What is the difference between consolidation and department breakdown?
Consolidation combines several separate legal entities into one P&L. Department or project breakdown splits one entity's P&L into segments like division, location, or engagement. They move in opposite directions: consolidation rolls up, department reporting splits down.
Fathom, Spotlight Reporting, and Syft Analytics (paid tiers) each document a 14-day trial. Jirav, LiveFlow, Planful, Datarails, Cube, Vena, and Aider do not offer trials.
Do any of these replace spreadsheets for P&L reporting?
Some do for specific workflows. Cube offers two-way sync with Excel and Sheets. Datarails consolidates data from spreadsheets into a single layer. LiveFlow connects QuickBooks or Xero data to spreadsheets. Whether they replace spreadsheets depends on the firm's process.
No. Aider is built for period-close automation and per-client AI reports. Its dashboard works across clients but does not produce a consolidated multi-entity P&L.